Finding the right toolchain to work on open documents

The source of this document (written is asciiDoc) is available on Github.
The pdf, html and slide versions of this document are also on Github.

The goal

I’d like to be able to write my courses and tutorials in one document, then convert them to slides / pdfs / ebooks / web pages at the click of a button.
On a second button click, I’d like these docs to be uploaded on the web to make them open access, versionable and fit for multi-authoring.

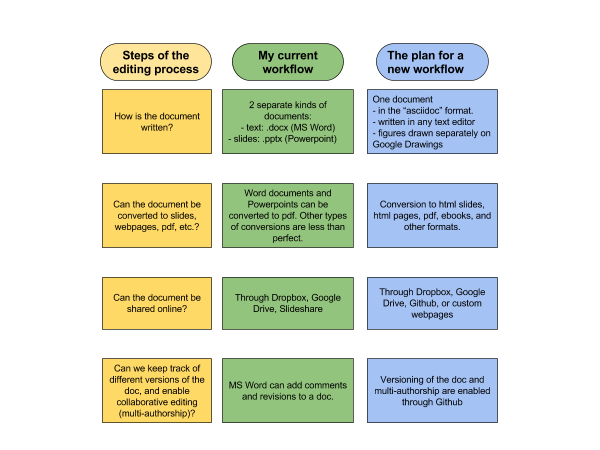
a-diagram-showing-the-authoring-steps-to-create-open-web-friendly-docs2

Figure 1. A diagram showing the authoring steps to create open, web friendly docs

In the previous blog post, I presented asciidoc as a promising technology to create easily open courses and tutorials.
It allows to write clean, minimum text files which then convert to web pages, pdf, ebooks and slides at a click of a button.

Just like you can write Word documents in MS Word or in Open Office, many tools exist to work on asciidoc.
I am still trying to figure out which one would best fit my needs. Because I program in Java, I looked at Java-based solutions because I can more easily adapt them to my needs.

AsciiDocFX?

I tried first AsciiDocFX, based on the emerging JavaFX technology. You can install it easily for Mac, Windows and Linux. Try it!
The great part is that you have an instant preview in html or slides, as you type.

Remember I want to embed pics and diagrams from Google Drawings into my docs? These pics have weird links like:
https://docs.google.com/drawings/d/1j00khDpGCzHQNvtJMwr6W52yhgslnLWvQgXwuNUAtZo/pub?w=450
which are not processed easily by AsciiDocFX.

A workaround is to first download the content of the web link as a file, then embed this file into the asciidoc.
I could not figure how to manage this from AsciiDocFX. It made me fear that AsciidocFX was too hard to customize, so I searched for a more flexible solution.

AsciiDocJ?

This is another Java version of the tools used to convert an asciidoc into web pages, pdf and the rest.
AsciiDocJ is not a software you install, this is a programming tool to be used in a programming environment.

  • I can use it from NetBeans, which is my favorite programming editor
  • Much less user friendly than AsciiDocFX (no preview of your docs), but I could live with that.
  • Provides full flexibility to manipulate the documents, by using code.

Web based pics can’t be embedded in my doc?
No problem, I can write some additional code which scans my doc, finds these web links and apply the necessary steps to make them right.
I am more confident that other bumps on the road of processing the conversion of docs (footnotes in books? transitions in slides? custom styling?) can be dealt with.

Next steps

AsciiDocJ is configured through Maven rather than in pure java code. Maven is a protocol written in Java to customize the assembly of the files of a project: zipping them, sending them to a server, executing them…
The trick is, Maven is configured through a quite complex XML file. I need some time to get acquainted to that.
If you read this post in html, slides, or pdf form this means I’ve made some progresses!

Towards a MOOC “Creating mobile apps” for entrepreneurs

In my school and in Lyon, the city where I live, everyone is helped in starting their entrepreneurial projects. Startup weekends, startup challengesboosters, incubatorsstartup creation projectsI visit and sometimes participate in these events. Listening to the pitches of the teams, I noticed something. 90% of them start the same way:

“So, our idea is to create an app, what it does is…”

But nobody in the team knows how to code an app. Nobody in the room, really, knows how to create an app. There is this hope that maybe, a geek friend from an engineering school will give a hand to code the app… or there is also the hope to convince a banker or a business angel to finance the prototype of an app… In practice, this almost never happens. Tons of excellent projects are abandoned or drag on forever because apps never materialize.

But what if apps could be created by everyone? Let’s dream a bit

iOS_Android_Windows_Phone_Wide1) everyone invited: not just those who already know how to code. Like, supra easy to create.

2) the app should be fantastic: not a web page packaged as a fake app, but a real app with access to all functionalities of the phone that it needs (camera, GPS, contacts…)

3) the app should be available on the Playstore (for Android), the App Store (for Apple), and Windows Phone’s Store.

4) and the tool to create the app should be free if possible. No yearly subscription to pay, no fee if the app is made for commercial use…

It can be done: Towards a MOOC “Creating mobile apps” for entrepreneurs

I am really excited to create a MOOC teaching anyone how to create mobile apps for Android, iOS and Windows Phone. It will open on Sept 2015. The objective of this MOOC is to take participants from a very basic starting point (no coding skills) to the creation of their own functional, native app available in Android, Apple and Windows Phone versions, and this in just 30 hours and for free. So that we see every entrepreneur able to launch their own apps.

How do I get more information?

– Subscribe to this mailing list: http://goo.gl/forms/TT7jKcKMHv

– Get in touch on Twitter! @seinecle

A special call for sponsorships This course could use the help of sponsors to make it as awesome as possible. Get in touch.

[EDIT 15/03/2015] First steps here! https://github.com/seinecle/Movie-Matcher/blob/master/readme.md

Call for abstracts – conf “Twitter for Research: Sharing Methods ans Results across disciplines”

This a one-day conference taking place in Lyon on April 24, 2015. Do consider submitting an abstract!

The impetus for co-organizing this conference was the realization that Twitter is used in many different corners in academia, and yet there is little interdisciplinary communication on it.

Researchers are not always aware of how Twitter is used in slightly or totally different ways across the scientific spectrum. Great collaborations, or at least new insights for research, could be born from a day of exchange on the varieties of ways Twitter is used in academic research.

To submit an abstract and get all the information: www.conftwitter2015.org
Some examples of how Twitter is used today for academic research:

Netnographies

Computational linguistics / natural language processing

– Social networks

Education

Marketing

Epidemiology

Finance

Media Studies

Crisis Management

Scientometrics

Journalism

Psychology

Comparing 3 free tools for sentiment analysis on Twitter

Umigon is a free tool for sentiment analysis on Twitter. There are already 2 outstanding free solutions for sentiment analysis out there, so you might wonder why Umigon was worth the effort.

I compare these 3 solutions in terms of 4 features (the 2 columns on the right are the most crucial)


Free to use for free text

Connected to Twitter

Works well with natural language (smileys, misspelled words, bad syntax)

Distinguishes between negative facts and negative sentiments

Sentiment140.com


NO

YES

YES

NO

Sentiment Analysis at Stanford


YES (limited to 200 lines)

  NO

NO

YES

Umigon


YES

YES

YES

YES

This is why Umigon can be useful:

– a tool that works well even on text with awful syntax (tweets!)

AND

– which makes a distinction between bad sentiment (“I hate war” -> negative sentiment) and sad facts (“War in Syria” -> neutral sentiment).

Next steps: offer an API, and continue researching on the detection of other semantic features of interest. Umigon already includes one: the detection of promoted discourse in tweets. Watch this space of follow me @seinecle for news!


Adventures in biggish data

This is going to be an evolving blog post retracing my current attempt at dealing with a dataset of 65 gigabytes. It will often look silly – that’s because I am not a programmer by training, and I make an effort at honestly recording the steps I took – including all mistakes and “doooohh!” moments.

See the bottom of the post for explanations on some questions. Add yours in the comments if you wish, I’ll do my best to respond.

I do this for the goal of  exploring this dataset visually (an interesting methodological question I find) – and maybe foremost, to learn how to work with big datasets in practice. That’s harder than I thought.

The dataset:

This is the IRI dataset, which is documented in the journal Marketing Science (link to the pdf, link to the jounal website).

It is delivered by post on a external hard drive containing a hierarchy of folders containing csv files (in various formatting) and excel files containing weekly data on product purchases in drugstores and shopping malls – collected across 10 years in participating stores in the US. The size of each file ranges from a couple of megabytes (Mb) to ~ 800 Mb. In total they make ~ 160 Gb, of which only 65 Gb I’ll end up using.

COUNTER OF COSTS SO FAR:

80 euros (server rental costs)
70 euros (one Terabyte external hard drive).

TOTAL ———–> 150 euros.

ACHIEVED SO FAR:

The files have been imported into a database.

Early november 2013

– delivery of the dataset (160Gb) on a 500Gb hard drive.
– reading of the 75 pages pdf coming with the dataset. The datasets contains several different aspects, I realize I’ll start using a portion of it, making 65Gb.
– copy of the dataset on the hard drive of my laptop (450Gb, spinning disk). Note: the laptop has a 2nd hard drive where the OS runs (SSD, 120Gb, almost full).
– I write Java code to parse the files and import them into a Mongo database stored on my 450Gb hard drive, using the wonderfully helpful Morphia (makes the syntax so easy).
– First attempts at importing: I realize that the database will be much bigger in size than the original flat files. Why? I investigate on StackOverflow and get to reduce the size of the future db significantly.
– Still, I don’t know the final size of the db, so there is the risk that my hard drive will get full. I buy a 1 Terabyte / USB 3.0 external hard drive (Seagate, 70 euros at my local store).

Mid November 2013

– First attempts to import the Excel / csv files into MongoDB on this external hard drive. The laptop grinds to a halt after  2 hours of so: memory issues. What, on my 16Gb RAM laptop? The cause: by design, MongoDB will use all the memory available on the system if it needs it. It’s supposed to leave enough RAM for other processes but apparently it does not. I feel stuck. Oh wait, running MongoDB on a virtual machine would allow for allocating a specific amount of RAM to it? I tried Oracle’s Virtual Box but long story short, I can’t run a 64b virtual machine on my 64b laptop because a parameter in my BIOS should be switched on to allow for it, but my BIOS does not feature this parameter (and I won’t flash a BIOS, that’s beyond what I feel able to).

– At this point I realize that the external hard drive I bought won’t serve me here. I need a distant server for the database where Mongo willl sit alone. Or were there other options to keep the data locally?

End November 2013

– I try to rent a server from OVH (13 euros for a month + 13 euros setup costs: 1 Terabyte server with a small processor from Kimsufi, their low cost offer). I don’t get access to it in the following 3 days, and give up. Got a refund later.

– I rent a server (at ~ 40 euros per month, no setup cost) with 2 Terabyte hard drives, 24Gb of RM (!!) and a high performing processor (i9720) from Hetzner’s auction site. Sounds dodgy and too good to be true, yet I get access to it within 3 hours, install Debian and Mongo on it (easier than I thought, given that I am a Linux noob).

– Re-run my Java code on my laptop for importing the Excel/csv files onto this distant server. New bottleneck: it takes ages for the data to transfer from my wifi to the server. Of course…

– I rent a second server (at ~ 40 euros per month, still at Hetzner), in the same geographical region as the first, where I’ll put the data and run my Java code from.
– Start uploading the data to it: takes ages (more than two weeks at this pace).

Early December 2013

– Went to my university to benefit from their transfer speed. After some hicups I got the 65Gb to transfer from my laptop to one of the remote servers I rented in just a couple of hours.
– Starting the import of these 65Gb of csv / Excel files from this server to the Mongodb server. Monitoring the thing since the last 30 minutes, I see that already 60,000,000 917,000,000 (close to 1 billion!!) weekly purchase data transactions have transferred to the db – and counting! (one transaction looks like “this week, 45 packs of Guiness were bought at the store XXX located at Austin, Texas for a total of 200$”). Big data here I come! For some reason the stores descriptions didn’t get stored yet though. I’ll see that later. Very excited about the 1 billion transaction thing. Also worried on how to query this. We’ll see.
– For some reason the database crashed after 1,1 billion transactions imported. Trying to relaunch the import where it stopped, I accidentally drop (delete) the database. Oooops.
– Before relaunching the import, I optimize a bit the code, clear a bug, and go!
– 14 hours that this new import has started. 2,949 stores found and stored, 138,985 products found and stored. And 1,3 billion transactions found and stored, and counting. Wow. No crash, looks good.
– 2 days after it started, the import has finished without a crash! 2.29 billion “weekly purchase data” entries were found and stored in the db. The csv / Excel files take 65Gb of disk space, but once imported in the db the same data takes 400 Gigabytes of space. Wow. Next step: building indexes and start a first query.

QUESTIONS:

– Why not using university infrastructures?

I am transitioning between two universities (from Erasmus University Rotterdam to EMLyon Business School) at the moment, that’s not the right moment to ask for the set-up of a server, which could take weeks anyway. When arriving at EMLyon I’ll reconsider my options. The other reason is that I want to learn how “big data” works in practice. My big dataset is still smallish, and I already run into so many issues. So I am happy to go through it, as it will give me a better comprehension of what’s involved in dealing with the next scale: terabytes. I feel that this first hand knowledge will give me to teach the students in a better way, and that I will make more informed choices when dealing with experts (IT admins from the university or the CNRS) when comes the moment to launch larger scale projects in big data.

– Why MongoDB?

I was just seduced by the easyness of their query syntax. That’s horrifying as a decision parameter, I know. Still, I stand by it. I feel that it is indeed a determining factor because if the underlying performance is good enough (I’ll see that), then as a coder I can choose the db system which is the less painful / nicest to use (though I don’t use it myself, the MongoDB javascript console is I think a main driver behind the adoption of Mongo as a default for the Node.js community, I think). And with the Morphia library added to it, Mongo for Java is just a breeze to use: create POJOs, save POJOs, query POJOs. That’s it:

Datastore ds = ...; // like new Morphia(new Mongo()).createDatastore("hr")
morphia.map(Employee.class);

ds.save(new Employee("Mister", "GOD", null, 0));

// get an employee without a manager
Employee boss = ds.find(Employee.class).field("manager").equal(null).get();

No table, rubbish query syntax or whatever.

Of course, I’ll see with this current experiment if Mongo fits the job or not in terms of performance. If it doesn’t, I’ll explore Neo4J or SQL (in this order).

– Why not Amazon services?

Yes, yes. I am constrained by my attachement to MongoDB here. I would have run MongoDB on Amazon and all would have been fine, maybe. But the instructions on how to run Mongo on Amazon EC2 got me scared.
Can Gephi become an explorer for 3D worlds / virtual realities?

[I am far from being an expert in 3D / virtual reality / vector shapes so feel free to send a tweet @seinecle for corrections if you spot mistakes below]

Soon possible in Gephi? source: http://www.playtool.com/pages/basic3d/basics.html

Yesterday I wrote a plugin that imports vector shapes of country maps (originally in .shp format) into Gephi. It is easy to think that not just 2D shapes like maps, but 3D, dynamic (time evolving) shapes could also be easily imported in Gephi. Because Gephi handles x, y and z coordinates, and handles time-dependent attributes too. So we’ve got all we need to view 3D worlds in Gephi. Here is how I would do it:

– write a parser of 3D shapes formats (DXF, X3D…).
– add the shapes to the graph. Each vector is two nodes and an edge connecting them. Putting that into Gephi is as simple as:

graph.add(node1);
graph.add(node2);
Edge edge = new Edge(node1,node2);
graph.add(edge);

Possible extensions

Yes, the code above would just give you wireframes. Already a good start. I am out of my league here, but I think that new shaders can be written and added to Gephi’s JOGL engine to accomodate for textures, etc. No?

We also need to write some code for mouse movements, to allow for the exploration of the scene in 3D. Not trivial, but this has been implemented in many languages already, so that should be easy to port.

Also, there is no video export function to record animations made in Gephi at the moment, and that’s a pity because movies of 3D animations of vector shapes in Gephi would then become possible. But that’s something that will arrive at some point.

Why would it be interesting?

Well, Gephi is a free even for commercial use, open source, solidly architectured and extensible, multi OS, memory efficient (check here) desktop app. That makes it a robust platform to reach users.

I am up for this project, and at this stage I would appreciate any feedback on the general perspective. Reach me @seinecle on Twitter.

New Gephi plugin: add background maps to your networks

I release a new plugin for Gephi: “Map of countries”.

This plugin is useful when you have a network with geolocalized agents. A plugin released by Alexis Jacomy already makes it possible to display your networks according to geographical coordinates. Now you can add country borders as a background!

You can download this plugin directly from your Gephi software on your computer: go to Tools -> Plugins -> Available plugins. Click on “Check for updates” and then look for “Map of Countries” in the list.

Instructions on how to use this plugin are available here: https://marketplace.gephi.org/plugin/maps-of-countries/

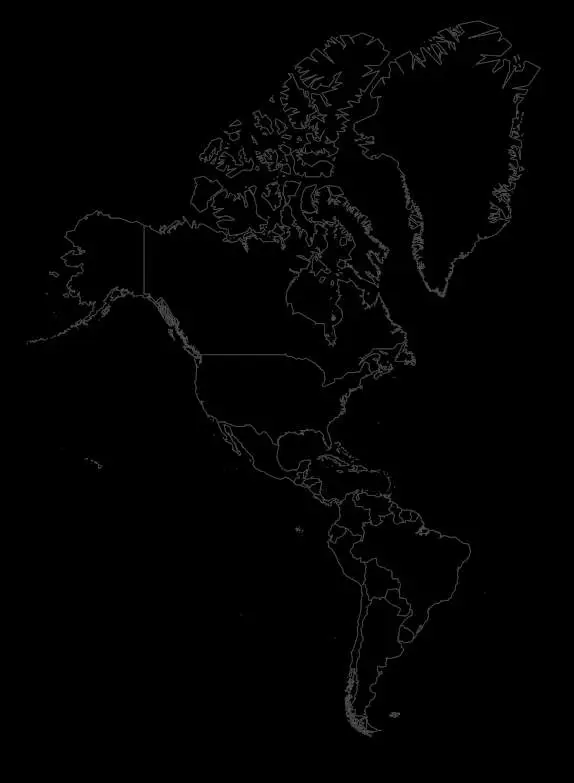
You can choose to display a world map:

world


or a continent:


continent


or a sub-continent:

subcontinent


or a single country (here, Mexico):

country


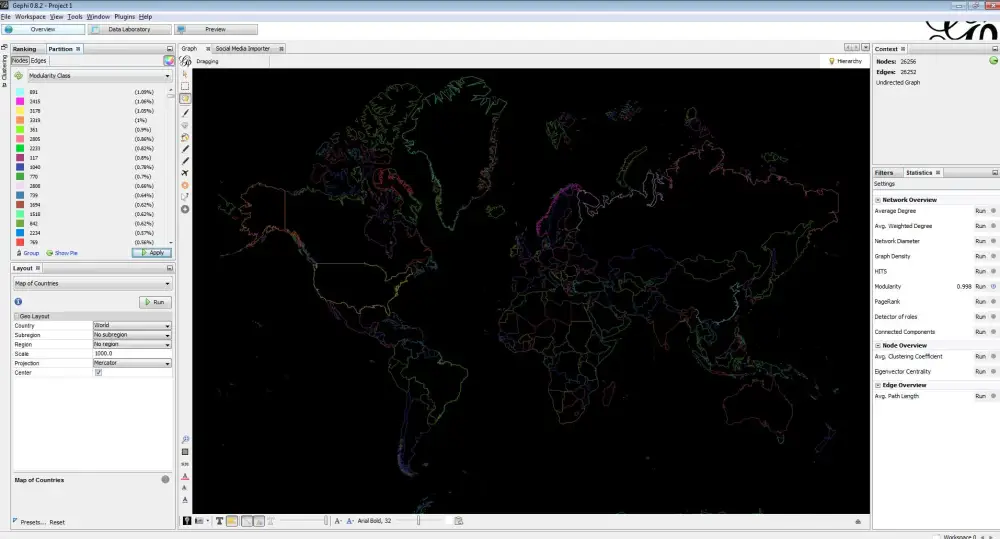
Note: as the map is basically made of nodes and edges just like any network, you can run functions on it. Here is the map of the world, with the community detection applied to it:

coloredworld


Enjoy!

Questions, feature requests, bug reports: https://github.com/seinecle/My-Plugins-for-Gephi/issues


(I am Clement Levallois, and you can find my work here, and follow me on Twitter).


Gephi – curated list of tutorials

gephi-logo-2010-text-orignal

1. General introductions to Gephi

Gephi Quick start by the Gephi Consortium
A slideshare presentation created by the Gephi team.

Introduction to network visualization with Gephi by Martin GrandJean
All the basics explained in one single web page with clear graphics.

Gephi: A tutorial for beginners
A pdf document,  a bit dense but complete by yours truly.

Gephi: A video tutorial by Stratidev (in French)
A Youtube video in 15 minutes.

Intro to Gephi Handout by Katya Ognyanova
4-page pdf with many screenshots introducing Gephi main functions, very readable.

Gephi Tutorial by Devin Gaffney
A simple web page with illustrations, with a Github repo for more advanced steps and examples of files to play around.

2. Tutorials focused on social media networks

Facebook Network Analysis using Gephi by Sarah Joy Murray.
How to visualize the network of your Facebook friends.

Step-by-step introduction tutorial to Gephi using Facebook network by  learly explained with many screenshots.

Getting Started With The Gephi Network Visualisation App – My Facebook Network part 1 and part 2 by Tony Hirst
A tutorial which has a lot of success.

Visualising Twitter Friend Connections Using Gephi by Tony Hirst
Very detailed, full of tips blog post on how to effectively create a viz of a Twitter network.

3. Gephi: tutorials on advanced functions

Gephi: A tutorial to visualize dynamic networks by myself.
A pdf doc on how to visualize networks that evolve in time with Gephi.

Visualisez dynamiquement le crawl du Googlebot avec Gephi by Aurelien Berrut
[in French]. An excellent blog post with screenshots on how to create dynamic networks from log data.

Getting started with Gephi by History Blogger
This is a small introductory tutorial, but it provides a step-by-step explanation on how to use the plugin SigmaJS to export a visualization to the web. Nice!

Video tutorials on filters and more, by Jennifer Golbeck
Very clearly explained v
ideos accompanying a book on “Analyzing the social web“.

Tutoriel sur les fonctionnalités avancées de Gephi : usage des filtres pour obtenir des cartographies plus lisibles, by  Guillaume Sylvestre
[in French]. Very detailed tutorial focusing on filters.

__________________________________________________________________

[add your tutorial there! Contact me at info[[[this is an arobase]]]exploreyourdata.com or post a comment below]

I am Clement Levallois, and you can find me on Twitter (@seinecle) or check my work on http://clementlevallois.net

Benchmark Akka vs regular Java

I think I found *the* solution for dealing with big data / big computations in Java. That’s called Akka, and I learned about it thanks to a tip from Miguel Biraud.

I had tried several solutions to speed up things but they did not work well:

– multithreading? Yes, but there is a hard limit at the number of threads available on your computer.

– GPGPU computing? Very hard to code, and I was disappointed by the performance of Java libraries supposed to ease the pain, like Ateji.

So, Akka!

That’s a framework for Scala and Java, still evolving very much. It uses the logic of actors to distribute work. Actors can create actors, which promises a nice multiplier effect. Actors can be created by millions!

Anyway, I created a small benchmark to make sure it was easy to code, and that it delivered some speed up even with a quick and dirty test. The results:

TEST 1

double loop through an array of 1,000 integers
operation: product of elements of arrays

nb of actors / operations Akka (in milliseconds) Regular java (in milliseconds)
10 150 150
100 1,200 5,600
1000 11,000 56,0000

conclusion test 1: Akka is faster by a factor of 5.

TEST 2

double loop through an array of 10,000 integers
operation: do some complex regex ops on a random String for each of the 10,000 steps

nb of actors / operations Akka (in milliseconds) Regular java (in milliseconds)
10 348 874
100 2,231 7,600
1000 20,000 75,000

conclusion test 2: Akka is faster by a factor of 3 to 4.

The setup was painless. The code was written by adapting the Hello World example provided on the site. The documentation is not that easy to follow, and as the versions of Akka are evolving quickly it makes it harder to rely on tutorials or StackOverflow Q&A even a few months old. But the logic of operations (actors receiving and sending messages) is quite straightforward.

Note that I did not use the “demultiplier effect” of Akka (Actors launching actors), which could have improved the result. Finally, this was performed on a laptop, whereas the real promise of Akka is on distributed environments (several servers working together). I don’t have a case of use yet for that, but this benchmark suggests that Akka will be very handy for these cases.

The code of the benchmark, and the results in an Excel file:

https://github.com/seinecle/AkkaTest/blob/master/README.md

I am Clement Levallois, and you can find examples of my work here or follow me on Twitter

Gephi – the possibilities of a data visualization platform

Gephi is a reference for the visualization of networks. It can become much more.

1. The first usage of Gephi is probably to, well, download it, install it and work with it. Simple, that’s how we know Gephi:

gephi_post_6


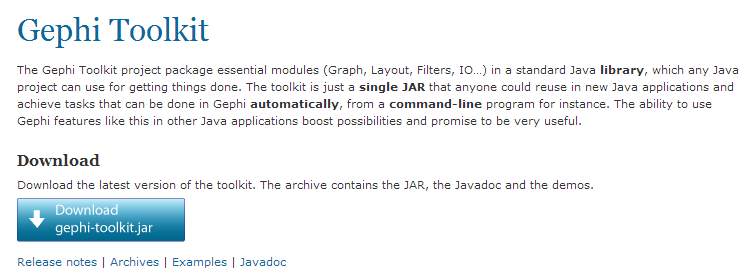
2. On the Gephi website, we see that a second use is possible: download the “Toolkit” version of Gephi.

gephi_post_1

This toolkit version of Gephi is made for programmers: there is no “window” appearing or anything, just pure code to execute Gephi functions automatically and repeatedly. For example:

– import a network

– apply a layout

– export the picture of the network to pdf.

– pick another network.

– repeat  previous steps x 1000

As the activity of the Gephi forum shows, there are many users who take Gephi this way.


3. Gephi also comes in a third flavor: Gephi plugins.

Plugins are basically little modifications that add  missing functions to Gephi. As a user of Gephi you probably ran in a situation when you wished this or that stuff could be done in Gephi. To name some:

– add a map as a background

– replace nodes by pictures, or any shape

– import twitter networks into Gephi

– run you prefered networks metrics, not present in the statistics panel.

Etc…

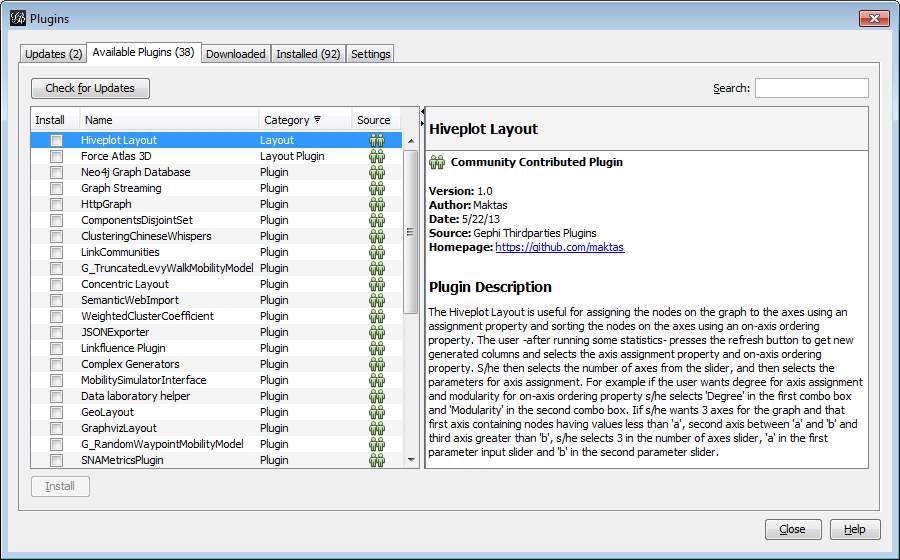
Gephi plugins can be written to do all that, adding all the functionalities that you need and which are not originally present in Gephi. Actually, many plugins have been written by individuals and firms to meet their needs, and they shared these plugins publicly. Anybody can  install these plugins directly from Gephi:

gephi_post_2

(open this window in Gephi by navigating in the menu: Tools -> Plugins)

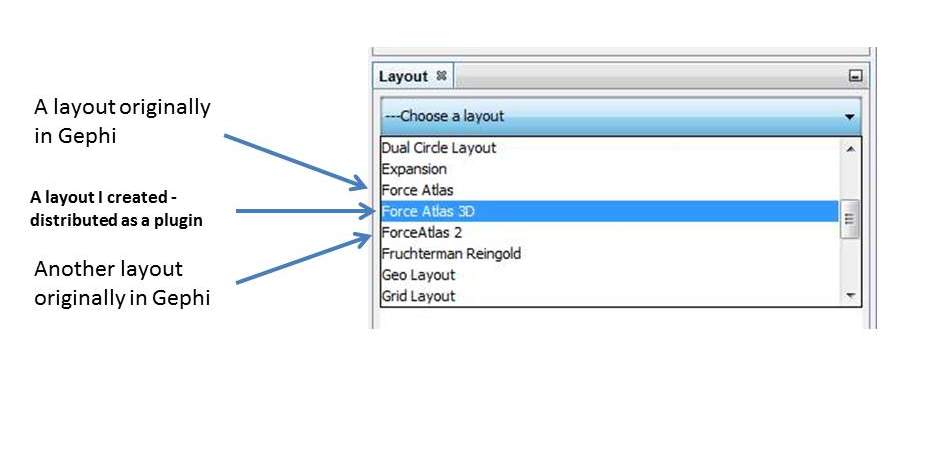
When a plugin you chose is installed in Gephi, they are integrated perfectly so that you see no difference with the original functions of Gephi:

gephi_post_8These plugins are also described and cataloged in a convenient way here: https://marketplace.gephi.org/plugins/. I personally developed 2 public plugins: one to sort isolated nodes alphabetically, another to apply a 3D layout. Certainly, many plugins have been written by firms for their inhouse needs.


4. Now, I really believe that Gephi is ready to develop into a 4th flavor: Gephi as a data visualization platform. How?

Gephi can be extended with plugins, we’ve seen that. The thing is, Gephi is itself made of plugins – that’s not a monolithic piece of written code. Each part of Gephi has the flexibility to be modified and extended. So that by creating new, elaborated plugins you are not just adding some minor features to Gephi – you actually transform Gephi into something quite new. Two examples:

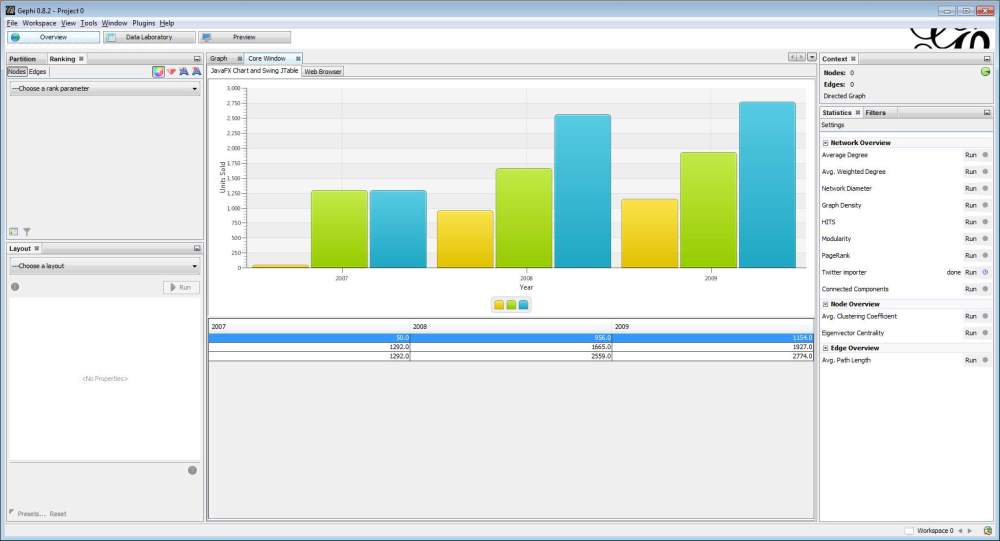
– displaying some barcharts in Gephi? Easy:

gephi_post_5

The barcharts above are made possible simply by adding a new plugin to Gephi (tech note: based on JavaFX. Example above was integrated in Gephi in 15 minutes following this tutorial).

But that’s just the beginning. I suppose that just like many others, I often face the Cornelian dilemma: web-based or desktop-based viz? You can actually include webpages into Gephi:

gephi_post_3

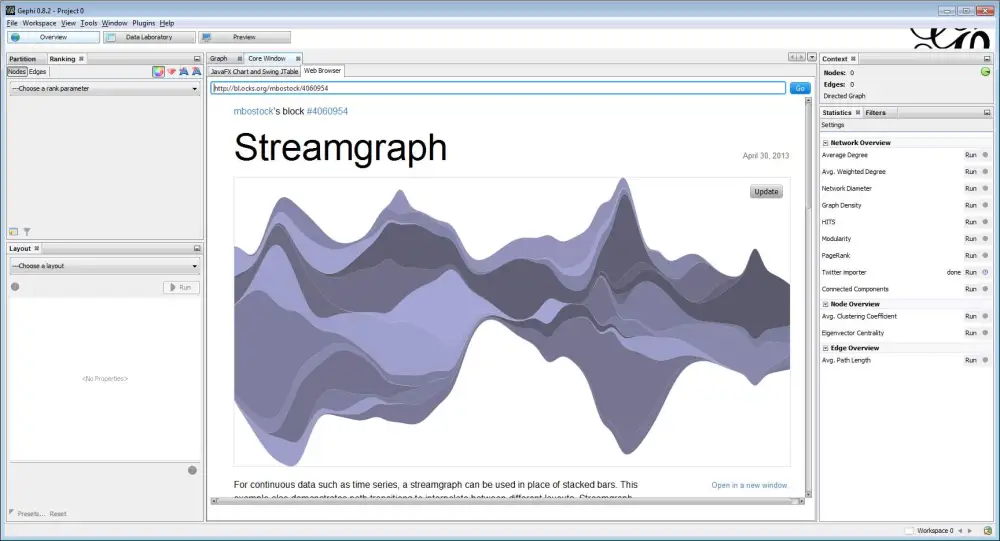
That’s the New York Times front page here, but let’s think of javascript based data visualizations – a d3.js viz why not:

gephi_post_4

There are some limits in terms of performance for web-based viz inside Gephi, but the screenshot above shows a perfectly functional and interactive d3js example inside Gephi. Think that it is possible to generate and load these viz from local js files based on local data…


In short, Gephi can be seen as a free, open-source, well-architectured data visualization platform – not just a network viz app. With the liberal license model chosen for Gephi (free for integration in commercial apps), this is surely a very effective solution to be explored by companies and data-vizzers in general.